
Loading in a Game#
Almost all usable features are centered around the Game object. The Game essentially contains all information you need to know to get started with your analysis. We will go over all information that is stored here and you might want to use, but lets first load in the game. You can choose to load in a game with your own data, or choose to download a open sourced game. To the game with you own data you can run the following code:
from databallpy import get_game, get_open_game

game = get_game(
  tracking_data_loc="../data/tracking_data.dat",
  tracking_metadata_loc="../data/tracking_metadata.xml",
  tracking_data_provider="tracab"
  event_data_loc="../data/event_data_f24.xml",
  event_metadata_loc="../data/event_metadata_f7.xml",
  event_data_provider="opta",
)

# or get the open game provided by Metrica
game = get_open_game(provider="metrica")
Current natively supported providers#
The current supported tracking data providers are:
Tracab (including Sportec Solutions from the DFL)
Metrica
Inmotio The accepted variables for the
tracking_data_providerare["tracab", "metrica", "inmotio", "dfl", "sportec"]
The current supported event data provider are:
Opta
Metrica
Instat
SciSports
Sportec Solutions (from the DFL)
Statsbomb The accepted variables for the
event_data_providerare["opta", "metrica", "instat", "scisports", "dfl", "sportec", "statsbomb","fifa"]
If you wish to use a different provider that is not listed here, please open an issue here
Statsbomb data#
For all providers you can specify the main data (event or tracking data file location) and the metadata file location. However, for Statsbomb, the metadata is split up in the game and lineup information. To load in event data of Statsbomb, please use the following code for the event data part (360 freeze frame data is not supported yet!)
game = get_game(
    event_data_loc="../data/events.json",
    event_game_loc="../data/game.json",
    event_lineup_loc="../data/lineup.json",
    event_data_provider="statsbomb",
)
Warning
It is perfectly fine to load your Game object with only tracking- or only event data. However, not that some features require both data streams, and will therefore raise an error when called.
Databallpy & Kloppy integration#
Kloppy is an open-sourced python package that specializes in parsing football related data. Thanks to the open source community we were able to make an integration that enables to transform a kloppy dataset into a databallpy Game object. Since Kloppy provides support for more providers than DataBallPy currently does natively, this will make it possible to load in even more data! For example Kloppy provides support for DataFactory, HawkEye, PFF, Signality, and many more!
For installation you can now use pip install 'databallpy[kloppy]'!
To use the load in data from the kloppy integration, you need to follow two steps: (1) create a Kloppy TrackingDataset and/or EventDataset (make sure to parse only_alive=False for tracking data):
from kloppy import sportec

event_dataset = sportec.load_open_event_data(match_id="J03WPY")
tracking_dataset = sportec.load_open_tracking_data(match_id="J03WPY", only_alive=False)
and (2) transform the kloppy dataset to a databallpy game object:
from databallpy import get_game_from_kloppy

game = get_game_from_kloppy(tracking_dataset=tracking_dataset,event_dataset=event_dataset)
Lets get started!#
For the sake of reproducability we will use the open game provided by Metrica in the remainder of this page:
from databallpy import get_open_game, __version__

print(f"The current version of databallpy is {__version__}")
The current version of databallpy is 0.7.3
game = get_open_game(provider="metrica", verbose=False)
Simple as that! Note that it might take a few seconds to load in your data. On top of that, it might be different for different data providers. Currently, the package is mostly optimized for loading tracab and opta data. For the other providers, without a doubt, improvements in performance can be made. All suggestions are welcome.
Game Attributes#
Metadata#
Before looking at the tracking and event data, lets first investigate the metadata of the game that is available. Firstly the game specific metadata:
The end score
The date
The pitch dimensions
The periods DataFrame
print(f"Game name: {game.name}\n")
print(f"Game home team score: {game.home_score} and the game away team score {game.away_score}\n")
print(f"The pitch length: {game.pitch_dimensions[0]} (m), and pitch width: {game.pitch_dimensions[1]} (m)\n")
print(f"Info about the first half periods: \n", game.periods.iloc[0])
Game name: Team A 0 - 2 Team B 2019-02-21 03:30:07

Game home team score: 0 and the game away team score 2

The pitch length: 105.0 (m), and pitch width: 68.0 (m)

Info about the first half periods:
 period_id                                           1
start_frame                                         1
end_frame                                       69661
start_datetime_td           2019-02-21 03:30:07+00:00
end_datetime_td      2019-02-21 04:16:33.400000+00:00
start_datetime_ed           2019-02-21 03:30:07+00:00
end_datetime_ed      2019-02-21 04:16:33.400000+00:00
Name: 0, dtype: object
Most of these are rather simple, but important to be able to access easily. The periods might require a little extra information. For every period_id, it hold information about both the tracking and the event data. td is short for “tracking_data” and ed for event_data. So in this game, the last frame of the first half (since period_id is 1), is 69661. Since both tracking and event data are provided by Metrica, the datetimes are already perfectly aligned. This is often not te case when using different tracking and event data providers. In this case, the start and end datetime thus refer to the start and end datetime of the first half.
Note
period_id”
1 = the first half
2 = the second half
3 = the first half of additional time
4 = the second half of the additional time
5 = the penalty shootout
Team and Player Information#
Some aditional team information stored in the Game. On top of that, information about the players is crucial for individual player and group analysis.
team id
team name
team formation
team players
print(f"The home team id = {game.home_team_id}\n")
print(f"The away team name = {game.away_team_id}\n")
print(f"The home team formation = {game.home_formation}\n")
print("The first away team player is:\n", game.away_players.iloc[0])
The home team id = FIFATMA

The away team name = FIFATMB

The home team formation = 1451

The first away team player is:
 id                       3595
full_name           Player 28
formation_place             0
position           goalkeeper
starter                  True
shirt_num                  28
start_frame              -999
end_frame                -999
Name: 0, dtype: object
The team names are anonimized by Metrica to open source the data. You can also see that the home team appears to have started at a 4-5-1 formation. Lastly, for every player, some important information is stored in the game.away_players dataframe. For instance, here you can find the player id, position, shirt number, etc.
Important
The start and end frame normally represent the frames where the players started the game, and when they ended the game. However, for Metrica we did not implement this yet. Therefore the value is -999. This is the default value for a missing integer value in DataBallPy. This is chosen since making it NaN would change to full column to a float64 object, while it should stay of type integer.
Tracking Data#
Tracking data captures the locations of all players and the ball, normally between 10 and 25 frames per second. This means that a pandas dataframe filled with these values have up to 200.000 rows. It is not really usefull to show how this dataframe looks like, but I will go over some other important additional information, and show all the preprocessing that has been done before getting to this cleaned format.
the tracking data
frame rate
tracking data provider
print(f"The tracking data provider = {game.tracking_data.provider}\n")
print(f"The tracking data frames per second = {game.tracking_data.frame_rate}\n")
print(f"The tracking data dataframe:\n", game.tracking_data[["frame", "ball_x", "ball_status", "home_11_x", "away_32_y", "period_id", "gametime_td"]].iloc[360:365])
The tracking data provider = metrica

The tracking data frames per second = 25

The tracking data dataframe:
      frame   ball_x ball_status  home_11_x  away_32_y  period_id gametime_td
360    361 -0.13125       alive  -35.92995        NaN          1       00:14
361    362 -0.11655       alive  -35.94360        NaN          1       00:14
362    363 -0.09975       alive  -35.95830        NaN          1       00:14
363    364 -0.08295       alive  -35.97510        NaN          1       00:14
364    365 -0.06615       alive  -35.99610        NaN          1       00:14
As you can see, the tracking data of a game is simply a pandas dataframe, making it easy to perform manipulation or filtering on the data. The tracking data has a few distinct columns:
Frame information: Depending on the provider, the frame number will start at 1 or at a timestamp for that day. In this case, it starts at one and counts up as time proceeds with 25 fps.
Ball information:
ball_x,ball_y, andball_zgive information about the position of the ball on the pitch. Be cautious withball_zsince it often is poor quality data.ball_statusis eitherdeadoralive, indication whether the game is playing or not.team_possessionindicates what team has possession of the ball. The values can either behome,away, orNone. For Metrica data it is put toNonesince the data does not indicate which team has possession. Later, you will see how you can use the event data to guess the team that is in ball possession.Player information: For every player the x (length) and y (width) coordinate are presented. The column name is based on the team the side the player plays for (either
homeoraway), the jersey number of that player, and the type of data that is presented (x coordinate or y coordinate). The column name for the x-coordinate of the player that plays for the home team with jersey 12 is thushome_12_x.General game information: The
period_idindicates what period of the game is played. A period id of1refers to the first half of the game, while2refers to the second half. Thegametime_tdcolumn gives the time in minutes:seconds of the game to give an indication of how far the game is along. It also tracks extra time, see the example below:
print(game.tracking_data[["frame", "ball_x", "ball_status", "home_11_x", "away_32_y", "period_id", "gametime_td"]].tail())
         frame  ball_x ball_status  home_11_x  away_32_y  period_id  \
143756  143757     NaN        dead  -39.90735    8.39732          2
143757  143758     NaN        dead  -39.90735    8.43404          2
143758  143759     NaN        dead  -39.90735    8.48572          2
143759  143760     NaN        dead  -39.90735    8.57548          2
143760  143761     NaN        dead  -39.90735    8.94676          2

       gametime_td
143756  90:00+4:23
143757  90:00+4:23
143758  90:00+4:23
143759  90:00+4:23
143760  90:00+4:23
Note
In the tracking data we make use of what we call a column_id. This represents a team and a jersey number (e.g. “home_12” or “away_4”). To get easy access to a specific set of players, make use of game.get_column_ids() method, in which you can specify the team, position and minimal minutes played and get back a list of column ids that pass the filters. For more information see our api reference.
Long or Wide#
In DataBallPy we have chosen to use a wide data format where every row in the dataframe is a single frame. However, we acknowledge that for some use cases a long format of data would be preferred. In a long format, the identifiers of a row is a combination of a frame and player id. After performing your preprocessing like filtering and adding velocity, you can export the tracking data to long format using the to_long_format function.
long_format_td = game.tracking_data.to_long_format()
long_format_td
| frame | column_id | x | y | z | velocity | ax | ay | acceleration | ball_status | team_possession | datetime | period_id | gametime_td | databallpy_event | event_id | sync_certainty | player_possession | dangerous_accessible_space | |
|---|---|---|---|---|---|---|---|---|---|---|---|---|---|---|---|---|---|---|---|
| 0 | 1 | ball | NaN | NaN | NaN | NaN | NaN | NaN | NaN | dead | home | 2019-02-21 03:30:07+00:00 | 1 | 00:00 | None | -999 | NaN | None | NaN |
| 1 | 2 | ball | NaN | NaN | NaN | NaN | NaN | NaN | NaN | dead | home | 2019-02-21 03:30:07.040000+00:00 | 1 | 00:00 | None | -999 | NaN | None | NaN |
| 2 | 3 | ball | NaN | NaN | NaN | NaN | NaN | NaN | NaN | dead | home | 2019-02-21 03:30:07.080000+00:00 | 1 | 00:00 | None | -999 | NaN | None | NaN |
| 3 | 4 | ball | NaN | NaN | NaN | NaN | NaN | NaN | NaN | dead | home | 2019-02-21 03:30:07.120000+00:00 | 1 | 00:00 | None | -999 | NaN | None | NaN |
| 4 | 5 | ball | NaN | NaN | NaN | NaN | NaN | NaN | NaN | dead | home | 2019-02-21 03:30:07.160000+00:00 | 1 | 00:00 | None | -999 | NaN | None | NaN |
| ... | ... | ... | ... | ... | ... | ... | ... | ... | ... | ... | ... | ... | ... | ... | ... | ... | ... | ... | ... |
| 5175391 | 143757 | home_17 | -2.30160 | -3.12256 | NaN | 1.516573 | NaN | NaN | NaN | dead | away | 2019-02-21 05:05:57.240000+00:00 | 2 | 90:00+4:23 | None | -999 | NaN | None | NaN |
| 5175392 | 143758 | home_17 | -2.32470 | -3.04572 | NaN | 2.659153 | NaN | NaN | NaN | dead | away | 2019-02-21 05:05:57.280000+00:00 | 2 | 90:00+4:23 | None | -999 | NaN | None | NaN |
| 5175393 | 143759 | home_17 | -2.36985 | -2.91788 | NaN | 4.352123 | NaN | NaN | NaN | dead | away | 2019-02-21 05:05:57.320000+00:00 | 2 | 90:00+4:23 | None | -999 | NaN | None | NaN |
| 5175394 | 143760 | home_17 | -2.44755 | -2.75604 | NaN | 6.587853 | NaN | NaN | NaN | dead | away | 2019-02-21 05:05:57.360000+00:00 | 2 | 90:00+4:23 | None | -999 | NaN | None | NaN |
| 5175395 | 143761 | home_17 | -2.47695 | -2.38068 | NaN | 9.382296 | NaN | NaN | NaN | dead | away | 2019-02-21 05:05:57.400000+00:00 | 2 | 90:00+4:23 | None | -999 | NaN | None | NaN |
5175396 rows × 19 columns
Pitch Conventions#
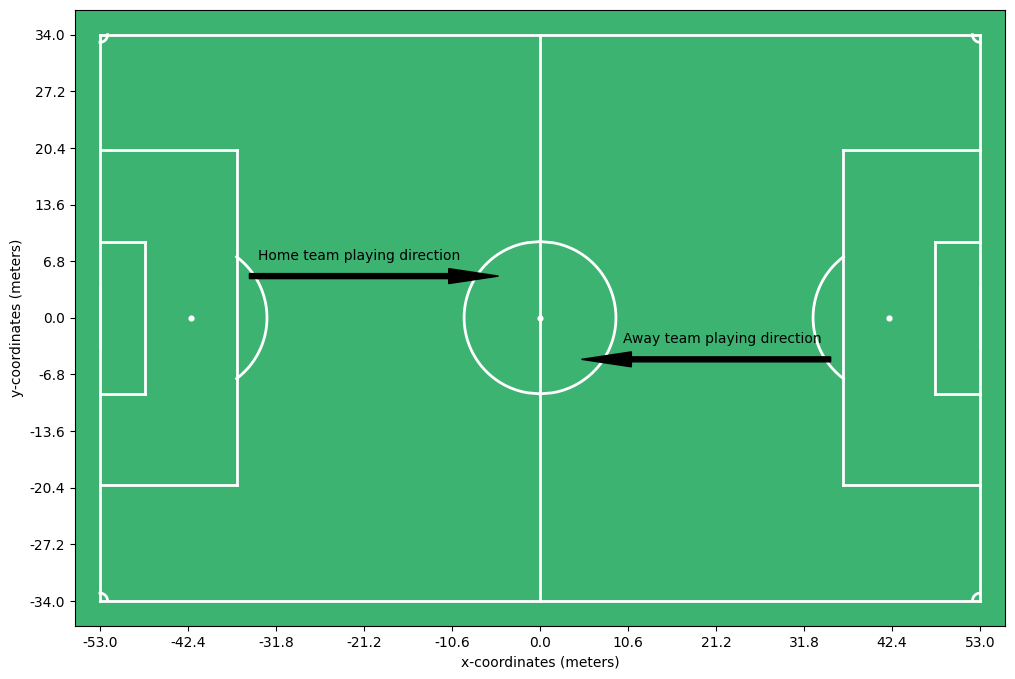
One additional important point is to talk about the pitch conventions. Event and tracking data do often not align. In most cases, event data providers (like Opta) have the positions scaled between 0 and 1. On top of that, they represent the player to which the event belongs as defending the goal at x = 0.0 and wanting to score at the goal at x = 1.0. This means that with every posession change, the playing direction of a team changes. Controversly, the tracking data providers (like tracab) often represent the situation as it is seen on tv, where teams switch half way. We choose to normalize the playing direction as follows:
The pitch center is coordinate (0, 0).
The coordinate values are in meters.
The home team is represented as playing from left to right for the full game.
The away team is represented as playing from right to left for the full game.
See the example below:
Note
In rare cases you might be interested in which halves the tracking data was swapped. This can be found in game._periods_changed_playing_direction which return a list with period ids where the home team actually played from right to left, instead of left to right (as it is represented in the tracking data)
Important
This is the only preprocessing that is done to the tracking data:
Scaling of coordinate so that they represent meters
Translating of coordinate so that the center of the pitch is at (0, 0)
Mirroring the data for certain periods (halves) so that the home team is represented as playing from left (low x values) to right (high x values) for the full game
Event data#
event data
event data provider
print(f"The game event data provider = {game.event_data.provider}")
print(f"The event data columns: {game.event_data.columns}")
The game event data provider = metrica
The event data columns: Index(['event_id', 'databallpy_event', 'period_id', 'minutes', 'seconds',
       'player_id', 'player_name', 'team_id', 'is_successful', 'start_x',
       'start_y', 'to_player_id', 'to_player_name', 'end_x', 'end_y',
       'original_event_id', 'original_event', 'event_type_id', 'td_frame',
       'datetime', 'tracking_frame', 'sync_certainty'],
      dtype='object')
Again, you can see that we are just dealing with a familiar pandas dataframe, nothing to be afraid of. Let’s go through all the columns before we take a look at the data:
event_id: a unique id (usually an integer) for the event.databallpy_event: a string indicating the event. Since we aim to create a standardized format of event data, we need to translate the
event data from the provider, in this case Metrica, to a standard event type, in this case that is databallpy_event. It currently can only have the values pass, shot, or dribble. For any other event, the value will be None. We aim to increase the number of databallpy events in future versions to be more complete.
period_id: the period that the event happened in.1indicating the first half and2the second half.minutes: the number of minutes in the game at the time of the event.seconds: the number of seconds in the game at the time of the event.player_id: an unique id of the player involved in the event.player_name: a string with the name of the player.team_id: an unique id for which team the event belonged to.is_successful: a boolian indicating if thedataballpy_eventwas successful (True) or not (False).start_xandstart_y: the coordinate, indicated by the event data provider, where the event took place. Note that these coordinates are scaled to fit the tracking data.original_event_id: The event id as provided by the event data provider.original_event: Sincedataballpy_eventmay not capture all events, we always keep in the original event data of the provider to make sure no data is lost in the process.event_type_id: an id indicating the type of event (often only used by event data providers themselves).datetime: a datatime object used to indicate when the event took place.
As you probably have notices, I skipped a few columns. That is because these columns are specific for Metrica, not all event data providers provide this data, and therefore these columns are not present in all event data dataframes.
to_player_idandto_player_name: Metrica sometimes indicate to which player the ball was passed. Since metrica indicates this information, we add it in the dataframe, but this column is not present for event data providers that do not indicate this in their data.end_xandend_y: the coordinate, indicated by the event data provider, where the event ended. Note that these coordinates are scaled to fit the tracking data. Also, this is again Metrica specific data, not all event data providers provide this data.td_frame: since this game uses tracking and event data fromMetrica, the two are already synchronised. Thetd_frameindicates what frame in the tracking data belongs to the event to get contextual information of that event.
Here is an example of what an event in the event data looks like:
print(game.event_data.iloc[13])
event_id                                           13
databallpy_event                                 pass
period_id                                           1
minutes                                             0
seconds                                         28.88
player_id                                        3570
player_name                                  Player 3
team_id                                       FIFATMA
is_successful                                    True
start_x                                      -32.9574
start_y                                     -24.63232
to_player_id                                     3578
to_player_name                              Player 11
end_x                                       -48.33255
end_y                                        -8.37284
original_event_id                                  14
original_event                                   pass
event_type_id                                       1
td_frame                                          722
datetime             2019-02-21 03:30:35.840000+00:00
tracking_frame                                    723
sync_certainty                               0.995776
Name: 13, dtype: object
Important
This is the only preprocessing that is done to the event data:
Scaling of coordinate so that they represent meters
Translating of coordinate so that the center of the pitch is at (0, 0)
Mirroring the data for specific events so that the home team is represented as playing from left (low x values) to right (high x values) for the full game.
Open Sourced Data#
If you want to simply try out the package, or you do not have data yourself, we have integrated 8 games with tracking and event data right into the package. The first 7 games are from the DFL, the german league. It includes 2 games of the first Bundesliga and 5 games of the second Bundesliga. The data is open sourced here and is associated with the paper “An integrated dataset of synchronized spatiotemporal and event data in elite soccer” by Bassek et al. For more information about the dataset, please consult the paper. In general, the tracking data is recorded at 25 fps, with the 5th generation Tracab optical tracking systems which provides, due to the increased number camera views, provides more stable data quality than gen4. The event data is provided by Sportec Solutions which works closely together with the DFL.
from databallpy.utils.constants import OPEN_GAME_IDS_DFL

for game_id, game_name in OPEN_GAME_IDS_DFL.items():
    print(f"{game_id}: {game_name}")
J03WMX: 1. FC Köln vs. FC Bayern München
J03WN1: VfL Bochum 1848 vs. Bayer 04 Leverkusen
J03WPY: Fortuna Düsseldorf vs. 1. FC Nürnberg
J03WOH: Fortuna Düsseldorf vs. SSV Jahn Regensburg
J03WQQ: Fortuna Düsseldorf vs. FC St. Pauli
J03WOY: Fortuna Düsseldorf vs. F.C. Hansa Rostock
J03WR9: Fortuna Düsseldorf vs. 1. FC Kaiserslautern
game = get_open_game(provider="dfl", game_id="J03WMX")
The last game is an anonymised game from Metrica, which can be obtained by running:
game = get_open_game(provider="metrica")
Caching#
Parsing an open game will download the game and cache it for future use. The next time you want to load the same game, it will load the data from the cache instead of re-downloading the game. The function will fail if you do not have an internet connection and have not cached the game locally yet.
By default, caching will be located on the dedicated cache directories of the different operating systems. You can overwrite the caching location by changing the environmental variable DATABALLPY_CACHE_DIR.
Conclusion#
In this chapter we have gone over the loading of a game, and the different attributes that are stored in the Game object. We have seen that the Game object contains all information you need to get started with your analysis. As you have seen, the Game is really all you need to get started with your analysis. However, in the next chapter we will go over some additional features that are available in the package.
Note
If you have any questions, suggestions, or improvements, please open an issue here