Preprocessing#
Introduction#
Preprocessing is always an important step of data analysis. In the case of soccer data, this mainly relates to the tracking data. Here we will show what kind of different preprocessing steps are available in DataBallPy and how you can run them. Before we can showcase anything, we will load in a match object.
from databallpy import get_match, get_open_match

match = get_match(
  tracking_data_loc="../data/tracking_data.dat",
  tracking_metadata_loc="../data/tracking_metadata.xml",
  tracking_data_provider="tracab"
  event_data_loc="../data/event_data_f24.xml",
  event_metadata_loc="../data/event_metadata_f7.xml",
  event_data_provider="opta",
)

# or get the open match provided by Metrica
match = get_open_match()
Note
The current supported tracking data providers are:
Tracab
Metrica
Inmotio
The current supported event data provider are:
Opta
Metrica
Instat
If you wish to use a different provider that is not listed here, please open an issue here
Note
The match object used in this example file contains 6 minutes of a match and is fully anonimised.
Filtering Data#
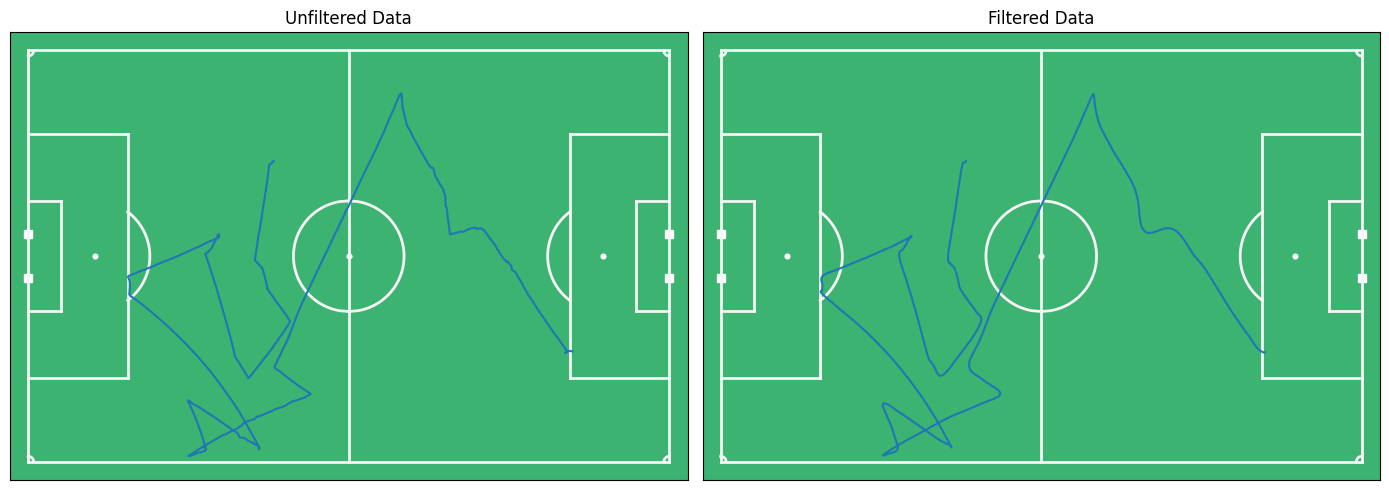
Soccer tracking data differs in quality, but in almost all cased filtering of coordinates is preferred. Tracking data is often captured by putting video footage of the match in deep learning models. Obstruction by other players can greatly influence the quality of the data. This is especially the case for the ball (the small ball is often obstructed) and in crowded situations (e.g. corner-kicks). For this situation we will apply a filter over the ball.
import matplotlib.pyplot as plt
from databallpy.visualize import plot_soccer_pitch
from databallpy.features.filters import filter_tracking_data

unfiltered_data = match.tracking_data
filtered_data = filter_tracking_data(match.tracking_data, column_ids="ball", filter_type="savitzky_golay", window_length=25, polyorder=2, inplace=False)

fig, (ax1, ax2) = plt.subplots(1, 2, figsize=(14, 5))
fig, ax1 = plot_soccer_pitch(fig=fig, ax=ax1)
fig, ax2 = plot_soccer_pitch(fig=fig, ax=ax2)
ax1.plot(unfiltered_data.iloc[2000:3000]["ball_x"], unfiltered_data.iloc[2000:3000]["ball_y"], label="unfiltered")
ax2.plot(filtered_data.iloc[2000:3000]["ball_x"], filtered_data.iloc[2000:3000]["ball_y"], label="filtered")
ax1.set_title("Unfiltered Data")
ax2.set_title("Filtered Data")
fig.tight_layout()
plt.show()
Note
Filtering of data might not be necessary depending on your specific needs. The high number of frames chosen here is only to showcase how the filtering works, not an advice on how many frames you should filter your data on.
As you can see, the filtered data looks less noisy. Currently, two filter types are supported: “savitzkey_golay” and “moving_average”. The window_length is the number of frames over which to filter, and should be adapted based on you specific data and sample rate. The polyorder argument is only used if “savitzkey_golay” is chosen as filter type.
The filter_tracking_data function is designed to apply filtering techniques to specific columns of a pandas DataFrame containing tracking data. This function supports two types of filters: the Savitzky-Golay filter and the moving average filter. It allows for in-place modification of the DataFrame or can return a new DataFrame with the filtered data.
Parameters#
tracking_data (
pd.DataFrame): The DataFrame containing the tracking data that needs filtering. This parameter is mandatory.column_ids (
str | list[str]): Specifies the columns to which the filter should be applied. This can be a single column name as a string or a list of column names.filter_type (
str, optional): Determines the type of filter to apply. The options are"savitzky_golay"and"moving_average". The default value is"savitzky_golay".window_length (
int, optional): Defines the length of the window used by the filter. This parameter is used by both filter types and defaults to7. For the Savitzky-Golay filter, this represents the number of coefficients (the polynomial order plus one). For the moving average, it specifies the number of points over which to average.polyorder (
int, optional): Specifies the order of the polynomial used in the Savitzky-Golay filter. This parameter is ignored when using the moving average filter. The default value is2.inplace (
bool, optional): If set toTrue, the filtering operation modifies the original DataFrame in place. IfFalse, the function returns a new DataFrame with the filtered data, leaving the original DataFrame unchanged. The default value isFalse.
Returns#
pd.DataFrame: If
inplaceisFalse, the function returns a new DataFrame with the specified columns filtered according to the selected filter type. IfinplaceisTrue, the function returnsNone, and the original DataFrame is modified in place.
Note
Column ID
The column ID refers to a player or the ball. If you wish to refer to the ball, you can use the string “ball”. If you wish to refer to a player, you can use the player’s side (e.g., “home” or “away”) and the player’s jersey number (e.g., “home_10” or “away_7”). The function adds the suffix “_x” or “_y” to the column ID to filter the x and y coordinates, respectively. If you would like to get all the column IDs of a team, you can also call match.home_players_column_ids() or match.away_players_column_ids().
Adding Velocity and Acceleration#
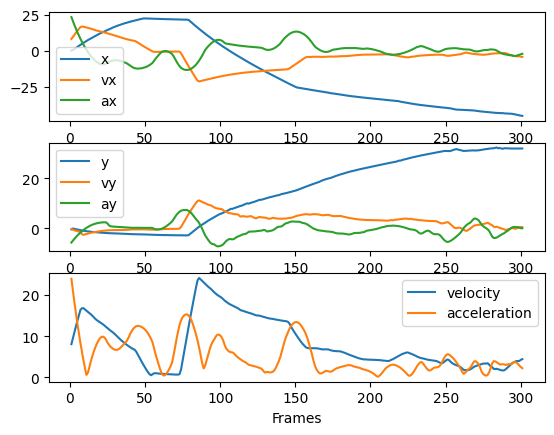
The next step in preprocessing is adding velocity and acceleration to the tracking data. This can be done by using the add_velocity and add_acceleration functions. The velocity is calculated by taking the difference between two consecutive frames and dividing it by the time difference. The acceleration is calculated by taking the difference between two consecutive velocities and dividing it by the time difference. The new columns are added to the tracking data dataframe.
from databallpy.features.differentiate import add_velocity, add_acceleration

match.tracking_data = add_velocity(
    match.tracking_data,
    frame_rate=match.frame_rate,
    column_ids="ball",
    max_velocity=50.,
    filter_type="moving_average",
    window_length=12,
    )
match.tracking_data = add_acceleration(
    match.tracking_data,
    frame_rate=match.frame_rate,
    column_ids="ball",
    max_acceleration=20.,
    filter_type="savitzky_golay",
    window_length=35,
    polyorder=2
    )

fig, (ax1, ax2, ax3) = plt.subplots(3, 1)

ax1.plot(match.tracking_data.loc[:300, "frame"], match.tracking_data.loc[:300,"ball_x"], label="x")
ax1.plot(match.tracking_data.loc[:300, "frame"], match.tracking_data.loc[:300, "ball_vx"], label="vx")
ax1.plot(match.tracking_data.loc[:300, "frame"], match.tracking_data.loc[:300,"ball_ax"], label="ax")
ax1.legend()

ax2.plot(match.tracking_data.loc[:300, "frame"], match.tracking_data.loc[:300,"ball_y"], label="y")
ax2.plot(match.tracking_data.loc[:300, "frame"], match.tracking_data.loc[:300,"ball_vy"], label="vy")
ax2.plot(match.tracking_data.loc[:300, "frame"], match.tracking_data.loc[:300,"ball_ay"], label="ay")
ax2.legend()

ax3.plot(match.tracking_data.loc[:300, "frame"], match.tracking_data.loc[:300,"ball_velocity"], label="velocity")
ax3.plot(match.tracking_data.loc[:300, "frame"], match.tracking_data.loc[:300,"ball_acceleration"], label="acceleration")
ax3.legend()
ax3.set_xlabel("Frames")

plt.show()
Note
The magnitude of the acceleration is calculated by taking the magnitude of the x and y acceleration, not by directly differentiating the velocity.
The add_velocity and add_acceleration functions are designed to calculate the velocity/acceleration of the players and the ball based on the tracking data. It adds new columns to the DataFrame containing the tracking data with the velocity values for each player and the ball.
Note
The acceleration is calculated by differentiating the velocity, so before you can use the add_acceleration function, you need to have used the add_velocity function.
Parameters#
tracking_data (
pd.DataFrame): The DataFrame containing the tracking data to which the velocity/acceleration columns will be added. This parameter is mandatory.column_ids (
str | list[str]): Specifies the columns for which the velocity/acceleration should be calculated. This can be a single column name as a string or a list of column names.frame_rate (
float): The frame rate at which the tracking data was recorded. This parameter is mandatory and can be obtained from the match object (match.frame_rate).filter_type (
str, optional): Determines the type of filter to apply to the velocity/acceleration data. The options are"savitzky_golay"and"moving_average". The default value is"savitzky_golay". Filtering is adviced during differentiating since it is known to amplify noise.window_length (
int, optional): Defines the length of the window used by the filter. This parameter is used by both filter types and defaults to7. For the Savitzky-Golay filter, this represents the number of coefficients (the polynomial order plus one). For the moving average, it specifies the number of points over which to average.polyorder (
int, optional): Specifies the order of the polynomial used in the Savitzky-Golay filter. This parameter is ignored when using the moving average filter. The default value is2.max_velocity or max_acceleration (
float, optional): The maximum velocity/acceleration value that a player can achieve (\(m/s\) or \(m/s^{2}\)). This parameter is used to clip the values to a maximum value. The default value isnp.inf.
inplace (
bool, optional): If set toTrue, the velocity/acceleration columns are added to the original DataFrame in place. IfFalse, the function returns a new DataFrame with the additional columns, leaving the original DataFrame unchanged. The default value isFalse.
Returns#
pd.DataFrame: If
inplaceisFalse, the function returns a new DataFrame with the velocity/acceleration columns added. IfinplaceisTrue, the function returnsNone, and the original DataFrame is modified in place.
Synchronizing Tracking and Event Data#
This is a crucial step in preprocessing. A different page will be created to clearly explain the synchronisation process. For now, we will just show how you can synchronise your data:
match.synchronise_tracking_and_event_data()
Ain’t that easy?
Team Possession#
One of the important things to know in a match is which team has possession over the ball. Some data providers, like Tracab, already include this information in their tracking data, however, not all data providers do. In this case, you can use the event data to approximate which team has possession. For this you can use the add_team_possession function. This function will use the databallpy events to guess which team is in possession of the ball for every frame. This function will only work after you have synchronized the tracking and event data.
from databallpy.features.team_possession import add_team_possession

match = get_saved_match(name="synced_match", path=os.path.join(os.getcwd(), "saved_matches"))
match.tracking_data.rename(columns={"ball_possession": "ball_possession_original"}, inplace=True)

add_team_possession(match.tracking_data, match.event_data, match.home_team_id, inplace=True)
match.tracking_data.loc[match.tracking_data["ball_status"] == "alive", ["ball_possession", "ball_possession_original"]].value_counts()
ball_possession  ball_possession_original
home             home                        3586
away             away                        1597
home             away                         407
away             home                         302
Name: count, dtype: int64
Okay agreed, it is not perfect. But it is a good start. The function will return a new column in the tracking data dataframe called “ball_possession”. This column will contain the team that is in possession of the ball for every frame.
Parameters#
tracking_data (
pd.DataFrame): The DataFrame containing the tracking data to which the possession column will be added. This parameter is mandatory.event_data (
pd.DataFrame): The DataFrame containing the event data. This parameter is mandatory.home_team_id (
int): The ID of the home team. This parameter is mandatory and can be obtained from the match object (match.home_team_id).inplace (
bool, optional): If set toTrue, the possession column is added to the original DataFrame in place. IfFalse, the function returns a new DataFrame with the additional column, leaving the original DataFrame unchanged. The default value isFalse.
Returns#
pd.DataFrame: If
inplaceisFalse, the function returns a new DataFrame with the possession column added. IfinplaceisTrue, the function returnsNone, and the original DataFrame is modified in place.
Individual Player Possession#
Similar to knowing which team has possession, it might also be necessary to know which individual player has possession for every given frame. The question becomes, when does a player has possession? This is a difficult question to answer, but currently we have implemented the propoces solution by a paper of Vidal-Codina et al (2022) : “Automatic Event Detection in Football Using Tracking Data”. The algorithm finds if the ball is within the possession zone (PZ) of a player, it losses the ball when the ball is outside of the PZ in a next frame and a different player gains the ball in his PZ. The ball is only gained when the ball changes direction or speed, to correct for balls that fly over players. A dedicated page will be created to show the exact calculations. For now, you can use the get_individual_player_possession function to add a column to the tracking data dataframe with the player that has possession for every frame.
from databallpy.features import get_individual_player_possession

get_individual_player_possession(match.tracking_data, inplace=True)
print(match.tracking_data["player_possession"].value_counts().head())
print(match.tracking_data["duels"].value_counts().head())
player_possession
home_2     581
home_4     402
home_5     335
home_10    259
away_7     172
Name: count, dtype: int64
duels
home_3-away_7     48
home_11-away_2    19
home_9-away_7     17
home_7-away_11    12
home_8-away_3     12
Name: count, dtype: int64
Seems like "home_2" had the ball in his poessession the longest. See the dedicated page of possession for more information about the player possession algorithm.
Conclusion#
This page showed the different preprocessing steps that are available in DataBallPy. The filtering of tracking data, adding velocity and acceleration, synchronizing tracking and event data, and calculating team and individual player possession are all important steps in the preprocessing of soccer data. These steps are crucial to ensure that the data is clean and ready for further analysis.
If you have any questions or improvements, feel free to open an issue on the GitHub page of DataBallPy!